Tableau allows its users the ability to change the level of granularity on a work sheet. In simple terms this means changing the level of detail considered in a visual. The more granularity you have, the deeper the level of detail. In this tutorial we will be covering the Include part of LOD in Tableau.
When it comes to Level of Detail (LOD) there are three main types, include, exclude, and fixed. In this tutorial we will be focusing on “include” which is simply including data of a higher level of granularity (detail) while being on the lower level.
Step 1: Joining data and creating a hierarchy
This first thing you must do is create a relationship between your data. In this example I have created a join on OrderId. Next you will need to navigate to a new sheet. Take note of your dimensions.
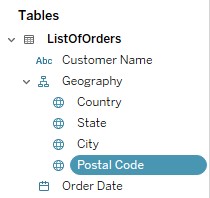
Now you are going to create a hierarchy. In this example I am using a dataset that has locations.
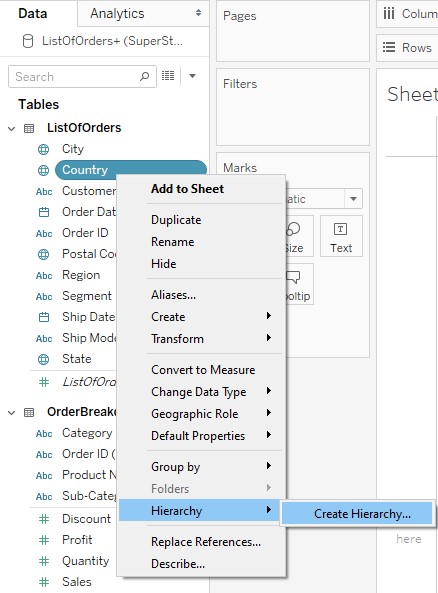
Next select Country and right-click. From here navigate down to “Hierarchy” and “Create Hierarchy”. We will call it “Geography”.
Now drag State, City and Postal Code in the same order.
Step 2: Creating the Map Visual
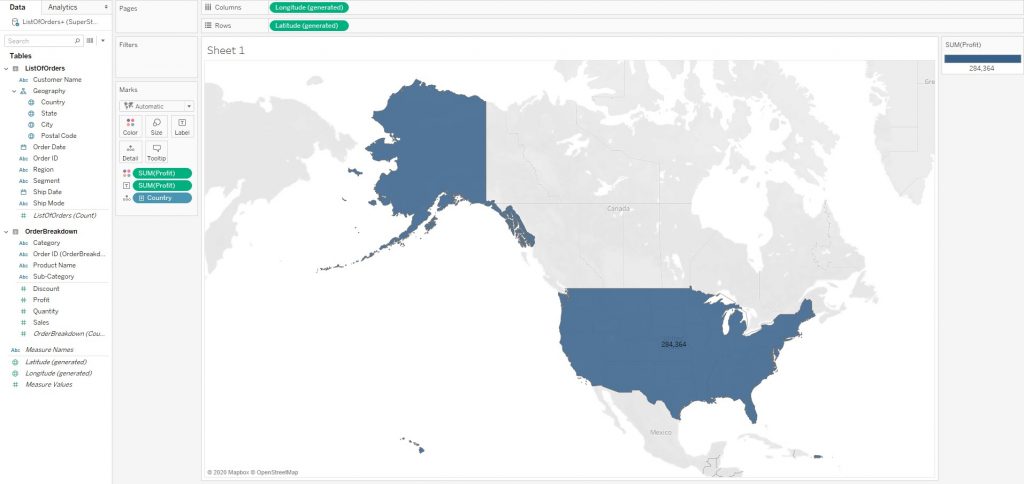
Go ahead and drag and drop “Geography” to the sheet. It will create a simple map based on your dimensions, in this example we are presented with a map of the United States. Next drag and drop “Profit” to both color and label under the “Marks Card”. Now go ahead and name the sheet “Map”.
Step 3: Adding the LOD Calculation
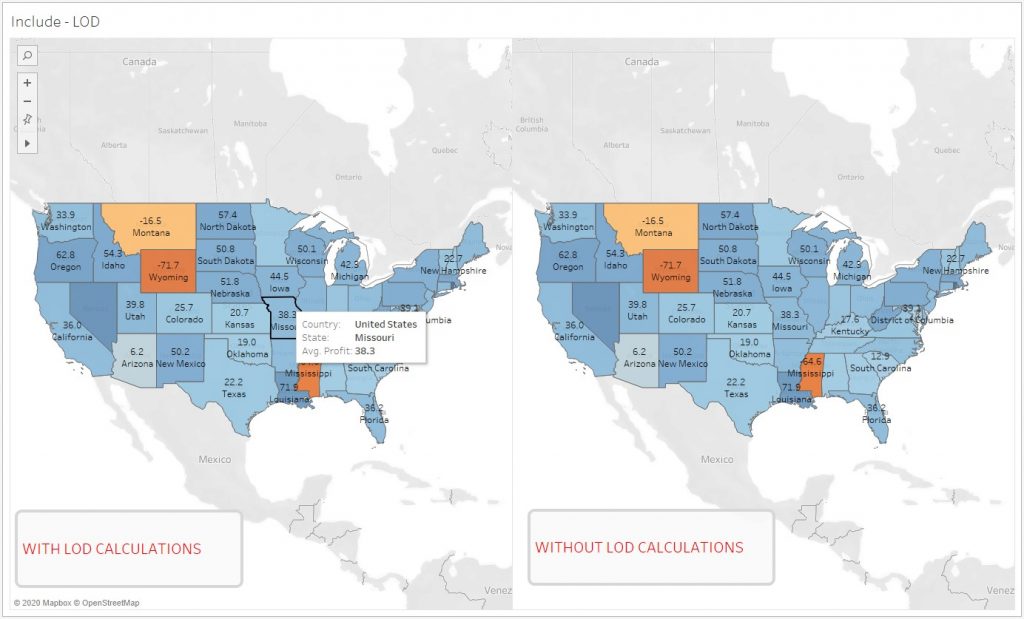
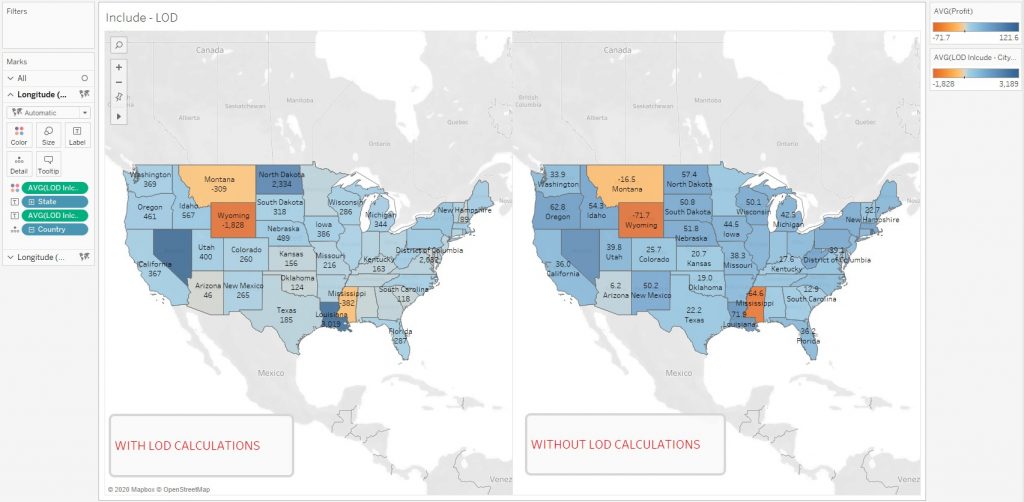
First, duplicate the sheet and rename it to “Include – LOD”. Next put the state in label and change the aggregation from SUM to AVG PROFIT. Now we will change the granularity of the map to city. Currently when looking at the visual we see that North Dakota, we have three cities – Grand Forks (-76), Mandan (4400), Dickinson (2678). In order to to get the average of these cities we need to use the Include calculation.
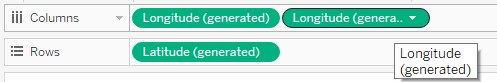
Navigate to the top of Tableau. Go to columns and click on “Longitude”. While holding down the “Ctrl” key drag and drop it to the right.
Step 4: Annotating and Formatting
To annotate, right click anywhere on the map and select “Annotate” and then “Area” from the drop down. In the edit window, type “WITHOUT LOD CALCULATIONS”. Now you can change the font and color. For this example I chose to change the font to 15 and bold and color to red.
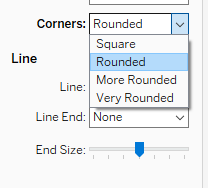
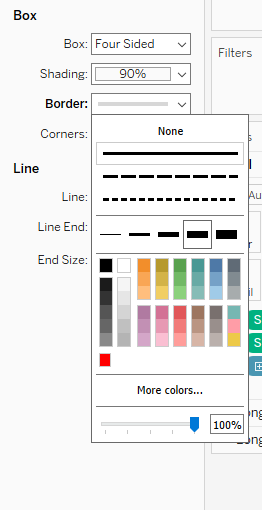
Next right click on the annotation box and select “Format”. From there navigate to the left side of the screen to format the box. Click on Border and select desired the width and color. Select the corner as Rounded.
You should now have a two maps side by side that show each state and their average profit displayed. Each state is also color coded by their AVG PROFIT.
Step 5: Applying the LOD Calculation
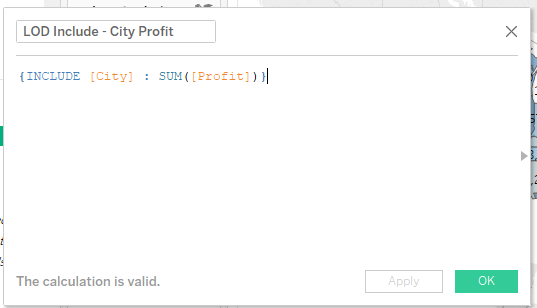
Now we will dive deep into the Include calculation. Create a calculate field “LOD Include – City Profit”. City and sum profit are used.
Finally, we will drag and drop the new calculate field into “Color” and “Label” for the map on the left. Change the aggregation from SUM to AVG. and change the aggregation of map on the right from SUM to AVG. Remove profit.
Congratulations! You have now successful created and implemented your first level of detail calculation in Tableau. S